In terms of runaway deficit spending, this presidency truly has been historic.
President Obama’s fourth budget has now been released, which allows for a relatively full accounting of deficit spending during his four years in office. The picture isn’t pretty, but it is revealing.
According to the White House’s own figures (see table S-1 here for 2011 to 2013, and table S-1 here for 2010), the actual or projected deficit tallies for the four years in which Obama has submitted budgets are as follows: $1.293 trillion in 2010, $1.300 trillion in 2011, $1.327 trillion in 2012, and $901 billion in 2013. In addition, Obama is responsible for the estimated $200 billion (the Congressional Budget Office’s figure) that his economic “stimulus” added to the deficit in 2009. Moreover, he shouldn’t get credit for the $149 billion in TARP (Troubled Asset Relief Program) repayments made in 2010 and 2011 to cover most of the $154 billion in bank loans that remained unpaid at the end of the 2009 fiscal year—loans that count against President Bush’s 2009 deficit tally.
Adding all of this up, deficit spending during Obama’s four years in the White House (based on his own figures) will be an estimated $5.170 trillion—or $5,170,000,000,000.00.
To help put that colossal sum of money into perspective, if you take our deficit spending under Obama and divide it evenly among the roughly 300 million American citizens, that works out to just over $17,000 per person—or about $70,000 for a family of four.
The previous record for most deficit spending during a presidency was set by President George W. Bush (see table 1.3 in the White House’s Historic Tables). During Bush’s 8-year administration, total deficit spending was $3.402 trillion. That’s a truly extraordinary and reckless sum. It’s also $1.768 trillion less than deficit spending in just four years under Obama. Per year, deficits under Bush averaged $425 billion. Per year, deficits under Obama (according to his own numbers) will average $1.293 trillion or more than three times as much.
Because the gross domestic product (GDP) nearly always grows from year to year, the most favorable way to view Obama’s deficit spending is as a percentage of GDP. Surely he can’t look as bad in that light, right?
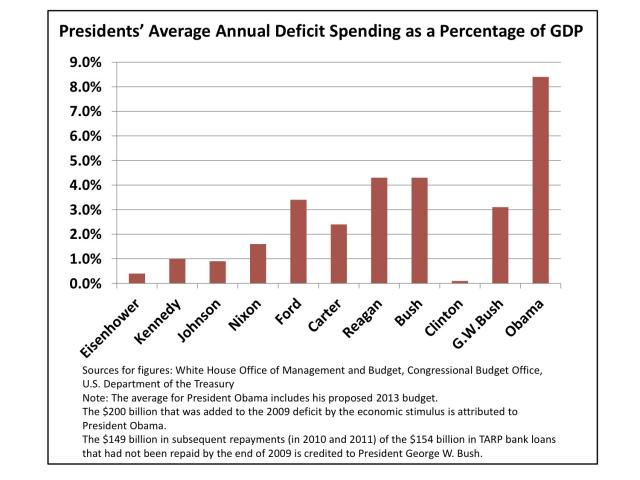
Well, prior to Obama, our annual deficit spending had only exceeded 6.0 percent of GDP during the Civil War, World War I, and World War II. Except during those huge conflicts, our deficits had never exceeded 6.0 percent of GDP in any year—not during the Great Depression, not at the height of the Cold War defense buildup, not ever. But that’s no longer the case. During Obama’s four years in the White House (and, again, using his own numbers), annual deficit spending will average 8.4 percent of GDP.
That’s nearly double the average annual level of deficit spending under any other post-War president. As the following chart shows, this has truly been a historic presidency—more profligate than any other by far:
© 2012 by The Weekly Standard. Reprinted with permission.